
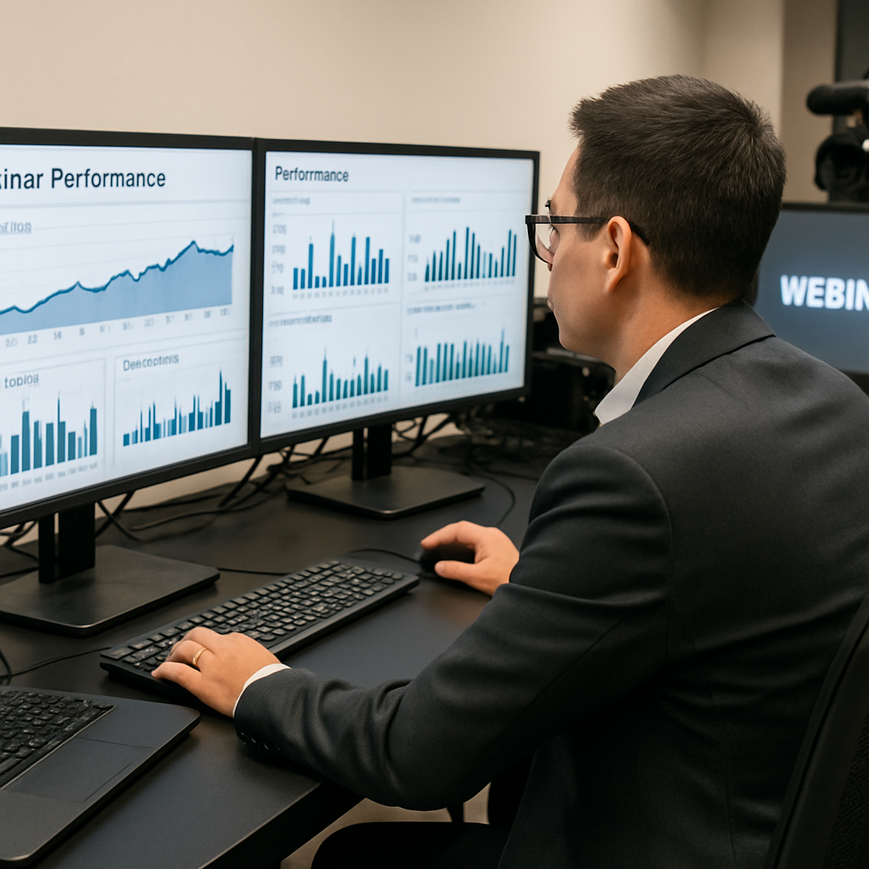
For many organisations in Singapore, webinars have become a practical way to educate clients, train staff, support regional teams, and generate qualified leads without the cost and logistics of large in-person events. Yet a webinar is only effective if you can measure what happened during the session, not just whether people registered. Real-time analytics gives event teams, marketers, and speakers immediate visibility into attendance, engagement, drop-off points, and technical performance, so they can make better decisions while the webinar is still live. For Singapore businesses that often serve local, regional, and global audiences across different time zones, this matters because audience attention is limited, internet conditions vary, and expectations for professional delivery are high. Measuring success in real time does not replace post-event analysis, but it helps teams respond quickly, improve the attendee experience, and protect the value of the webinar investment.
In practice, real-time analytics refers to the live collection and display of data while the webinar is happening. This can include registration-to-attendance conversion, concurrent viewer counts, watch time, poll responses, chat activity, question volume, click-through rates on links or calls to action, and technical metrics such as buffering or connection issues. When used properly, these measurements help teams understand not only how many people joined, but how they behaved, what content held attention, and where the audience lost interest. That is especially relevant in Singapore, where professionals often attend webinars between meetings, during lunch hours, or after work, and where even a short interruption can cause a participant to leave. Real-time analytics gives the organiser a chance to adapt before the opportunity is lost.
Why real-time analytics matters for webinar success
Webinar success is not a single number. A high registration count means little if most attendees leave within ten minutes, never ask a question, or experience technical problems. Real-time analytics helps define success more accurately by showing how people interact with the session minute by minute. This is important for B2B webinar organisers, professional training providers, healthcare educators, and public-facing organisations in Singapore because audience engagement can differ widely depending on the topic, language, delivery style, and timing.
One of the most useful advantages of live analytics is the ability to detect engagement patterns early. If attendance falls sharply after a long introduction, the host can shorten the next section or bring forward a key case study. If a poll receives unusually low participation, the speaker may need to explain the question more clearly or encourage responses verbally. If a Q&A segment becomes active, the moderator can extend it and reduce less important content later. These are practical, in-session decisions that can improve the attendee experience immediately rather than waiting until the webinar has ended.
Real-time analytics also supports accountability. Event teams can see whether the webinar delivered against the intended objective, whether that objective is education, lead generation, internal communication, or public information sharing. For example, a Singapore-based enterprise hosting a product demonstration may care less about raw attendance and more about how many participants stayed until the pricing discussion or clicked to request a follow-up consultation. A professional association may care more about completion rate and live question volume. The analytics dashboard should reflect the goal of the webinar, not just generic event metrics.
What success should mean for different webinar formats
Different webinar formats require different success indicators. A training webinar for employees may prioritise attendance consistency and post-session quiz completion. A sales webinar may focus on engagement with product features, link clicks, and meeting-booking actions. A public education session may value sustained watch time and clear comprehension signals such as poll accuracy or questions asked in chat. In Singapore, where webinars may serve multilingual or cross-border audiences, it is also useful to evaluate whether the content is accessible to participants with different levels of familiarity with the topic. Success should be measured against purpose, not against a generic benchmark copied from another organisation.
Key real-time metrics that reveal audience behaviour
The most effective webinar analytics dashboards combine behavioural, engagement, and technical indicators. No single metric tells the whole story, but together they provide a more reliable view of how the session is performing. Understanding these metrics allows teams to interpret live data properly and avoid overreacting to one isolated spike or drop.
Attendance, reach, and drop-off patterns
Attendance data shows how many registered participants actually joined and when they entered or exited the session. The registration-to-attendance ratio helps teams judge the effectiveness of reminders, calendar invites, and topic appeal. Drop-off patterns are equally important because they show the moments when interest declined. If many attendees leave during a speaker introduction, the opening may be too long or not sufficiently focused. If departures happen during a technical segment, the content may need simplification or more visuals.
In Singapore, where professionals often schedule webinars tightly around work commitments, drop-off may also reflect timing rather than content alone. A webinar that runs over lunch may lose attendees when they return to meetings. A late evening session may lose parents or caregivers who need to manage family responsibilities. Real-time analytics helps organisers spot these patterns and adjust future scheduling with more confidence.
Engagement signals from polls, chat, and questions
Engagement metrics are often the clearest indicators of whether participants are mentally present. Poll participation shows whether attendees are willing to respond in the moment. Chat activity can reveal confusion, interest, or agreement. Live questions often indicate that the material is relevant and that the audience trusts the speaker enough to seek clarification. These signals are especially useful in Singapore’s business and professional settings, where audiences may be reserved at first but become more responsive when the format is clear and the moderator actively invites participation.
To interpret engagement correctly, it helps to compare different types of interaction. A large number of chat messages may indicate interest, but not necessarily understanding. A small number of thoughtful questions may be more valuable than a flood of brief comments. Polls can be designed to test comprehension, collect preferences, or segment the audience for follow-up, but the question must be easy to understand and relevant to the session. Real-time analytics shows which interaction methods work best, so organisers can refine the structure over time.
Watch time and attention retention
Watch time measures how long participants remain connected and actively viewing the webinar. It is one of the strongest indicators of content relevance. If viewers stay for most of the session, the topic, pacing, and delivery are likely working well. If retention drops sharply at specific points, those moments deserve review. This may signal overly dense slides, a long monologue, unclear explanation, or a disconnect between the audience’s expectations and the content being presented.
Retention data is especially valuable for longer webinars or hybrid sessions that combine presentations, demos, and panel discussions. It can show whether the audience prefers short, structured segments or deeper expert discussion. For Singapore audiences, who are often used to concise and efficient communication, strong retention usually depends on clear signposting, purposeful transitions, and content that gets to the point without unnecessary padding.
Technical performance and viewing quality
Technical metrics are often overlooked, but they are essential to success. Buffering, audio issues, connection instability, and device compatibility problems can all reduce engagement even if the content is strong. A webinar can fail simply because participants cannot hear the speaker clearly or the stream stutters at the wrong time. Real-time analytics helps production teams identify these issues while the event is still underway.
This matters in Singapore because webinar audiences may join from office networks, mobile connections, or shared workspaces. Some may be overseas, where network conditions differ. Monitoring live technical quality allows the organiser to pause, switch slides, adjust audio, or coordinate with the streaming team before the issue affects too many participants. Good webinar production is not only about content delivery, but also about stable access to that content.
How to use live analytics during the webinar, not after it
Many teams collect data but do not act on it in time. The real value of live analytics comes from using it to guide decisions during the webinar. This requires a clear workflow, a dedicated moderator or producer, and agreed thresholds for action. For example, if attendance drops significantly after a product overview begins, the producer can alert the speaker to move faster into the use case section. If polls are underperforming, the host can restate the question and explain why participation matters. If there is a sudden spike in questions, the moderator can extend the Q&A or group similar questions to maintain flow.
In well-run Singapore webinars, the presenter and production team should review the dashboard throughout the session, not just at the end. A live producer can watch engagement trends while the speaker focuses on content delivery. This separation of roles improves responsiveness and helps the session feel more polished. It also reduces the risk of missing important signals because the speaker is too focused on presenting to notice audience fatigue or technical trouble.
Using data to improve pacing and content structure
Analytics can reveal whether the webinar is too fast, too slow, or too dense. If participants disengage during long explanations, the next webinar may need shorter slides, simpler language, or more visual examples. If engagement rises when the speaker presents a case study or demo, that format should appear earlier and more often. If questions concentrate around a single topic, the organiser may need to allocate more time there in future sessions.
This is where real-time analytics becomes operationally useful. It turns audience behaviour into feedback that can be acted on immediately and applied to later sessions. Over time, this leads to more effective webinars, better speaker preparation, and stronger audience trust.
Aligning analytics with business or communication goals
Not every webinar is designed to drive the same result. Some aim to educate, some to persuade, and some to support internal change management. The metric choice should match the objective. If the goal is lead generation, then real-time link clicks, form submissions, or meeting bookings matter. If the goal is knowledge transfer, then retention, poll accuracy, and question quality may matter more. If the goal is stakeholder communication, then attendance from the intended audience group and the clarity of post-event understanding may be most important.
For Singapore organisations working across sectors such as finance, technology, education, healthcare, and professional services, this alignment is especially important. A webinar designed for client acquisition should not be judged only by chat volume, and a staff training session should not be judged only by sales-related click-throughs. The analytics framework must be tailored to the event’s purpose.
Singapore-specific considerations for measuring webinar performance
Singapore’s business environment places a premium on efficiency, professionalism, and measurable outcomes. That makes real-time analytics particularly relevant. Attendees often expect the webinar to start on time, deliver a clear agenda, and respect their schedule. They may be joining from offices in the Central Business District, industrial estates, home offices, or while travelling across the region. Because of this, organisers should use analytics to understand not only what content worked, but also how timing, device access, and audience expectations affected participation.
Local organisations should also pay attention to data privacy and consent practices. In Singapore, personal data handling should be managed in line with the Personal Data Protection Act, including appropriate notice and consent where required. Webinar analytics should be collected and used responsibly, with clear communication about what data is gathered and why. This is particularly important when tracking attendance, engagement, and follow-up behaviour for marketing or training purposes.
Another practical Singapore consideration is multilingual or cross-cultural delivery. Some webinars include English as the primary language, but participants may have different levels of fluency or sector-specific vocabulary. Real-time analytics can help identify whether participation drops after jargon-heavy sections or whether audience engagement improves when the speaker uses concrete examples. For public organisations and professional service firms, that information is valuable because it supports clearer communication across diverse groups.
Operational examples from common Singapore webinar use cases
A healthcare education webinar for corporate wellness teams may use live polls to check understanding of prevention tips, then adjust the pace if responses show confusion. A financial services webinar may track when attendees click to download a guide or request a callback, using that data to assess commercial interest. A hybrid conference hosted by a Singapore events team may use real-time retention data to decide whether to keep a panel discussion running longer or move sooner to audience questions. In each case, the metric is not the goal by itself, but a signal that helps the team deliver a better experience and stronger business result.
Turning analytics into a repeatable improvement process
Real-time analytics is most effective when it becomes part of a continuous improvement cycle. First, define the webinar goal and the few metrics that matter most. Second, monitor live data during the session and make practical adjustments when patterns change. Third, review the session afterwards to compare what the analytics showed with what the team observed. Finally, apply the lessons to the next webinar. This process helps teams move beyond one-off event reporting and toward consistent performance improvement.
It is also wise to combine quantitative data with human observation. Analytics can show that attendance dropped, but a producer may know that a speaker used a long preamble before getting to the core message. Data can show that the chat was active, but the moderator may notice that most questions came from one highly engaged subgroup rather than the entire audience. Using both live metrics and professional judgement produces a more accurate picture of success.
For Singapore organisations investing in webinars as part of their communication, training, or business development strategy, the message is clear. Real-time analytics is not just a reporting tool, it is a decision-making tool. It helps teams understand audience behaviour as it happens, respond to issues quickly, and refine future sessions with more precision. When used thoughtfully, it supports better content, stronger engagement, and a more reliable return on the time and resources invested in each webinar. The most successful webinars are rarely the ones that simply attract attention. They are the ones that maintain it, measure it, and learn from it in real time.
General information only: This article is intended for general educational purposes and does not replace professional legal, technical, or data protection advice for your organisation’s specific webinar setup.

Jeremy Lee is a seasoned digital marketing director and strategist with over two decades of experience in the industry. As the founder of Sotavento Medios, I manage a diverse portfolio of over 50 businesses, helping brands grow through advanced search strategies and digital innovation. My work focuses on bridging the gap between traditional search engine optimisation and the evolving world of AI-driven answer engines.
get in touch