
The Engineering Behind Engagement: Translating Post-Event Data into Business Intelligence
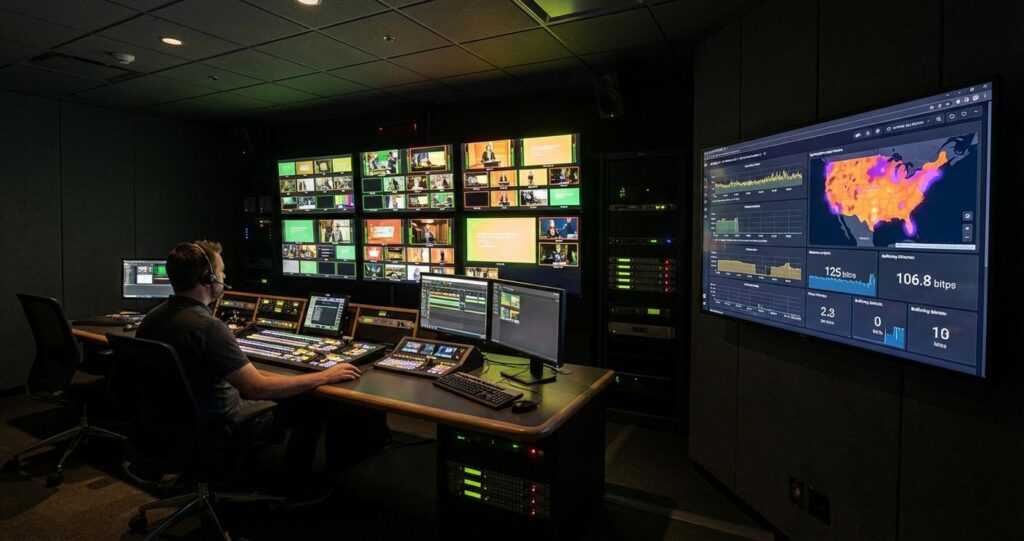
In the world of professional B2B event streaming, the broadcast does not end when the final presenter leaves the stage. For corporate communications and IT infrastructure teams, this is merely the transition from real-time operations to data analysis. The true business value of a corporate town hall, product launch, or hybrid conference is not just in the live delivery; it is crystallized in the post-event analytics. However, these analytics are not simple marketing metrics. They are the direct output of a meticulously architected production and delivery infrastructure. Understanding this data requires a technical perspective on how it is generated, collected, and correlated across the entire signal chain, from the camera sensor to the end-user’s device.
This analysis moves beyond rudimentary view counts. We will explore the technical underpinnings of a robust analytics strategy, examining how Quality of Service (QoS) and Quality of Experience (QoE) metrics are captured, what they signify about your network and production choices, and how they provide actionable intelligence for future corporate communications. We will detail the specific data points that matter, the infrastructure required to capture them reliably, and the methodologies to translate raw data streams from Content Delivery Networks (CDNs) and Online Video Platforms (OVPs) into a clear justification for infrastructure investment and content strategy refinement. This is not about counting clicks; it is about quantifying the performance of your entire communications pipeline.
Architecting the Data Capture Pipeline: From Signal Ingest to User Playback
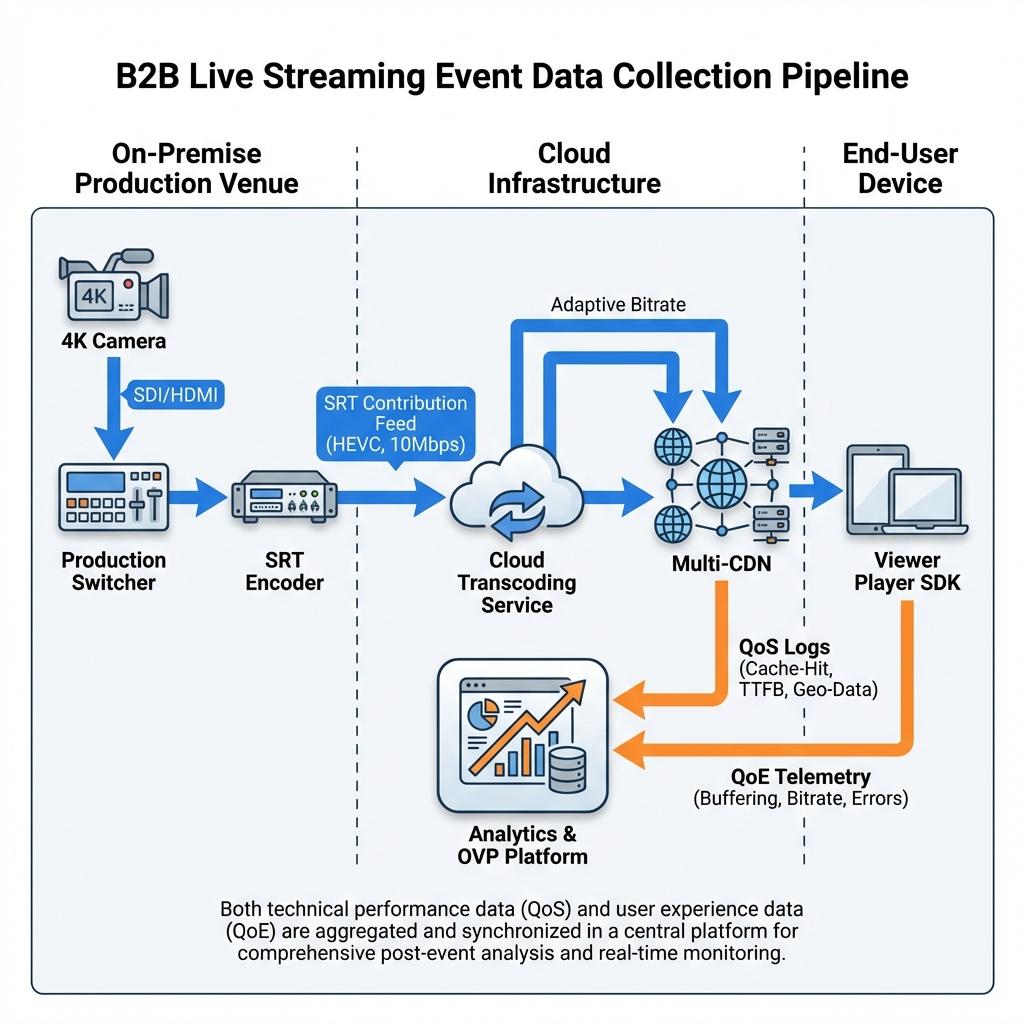
The integrity and granularity of post-event analytics are fundamentally dependent on the architecture of the streaming workflow. Every component, from the on-premise encoder to the cloud-based transcoder and the final CDN edge server, is a potential data source. A comprehensive data strategy involves capturing and correlating information from each stage to build a complete picture of event performance.
Player-Side Analytics: Capturing Quality of Experience (QoE) at the Edge
The most valuable insights often come directly from the end-user’s player. Modern enterprise video players are equipped with sophisticated Software Development Kits (SDKs) that report a continuous stream of telemetry back to the OVP. This is the source of QoE metrics, which measure the subjective experience of the viewer. Key metrics captured here include:
- Buffering Ratio: The percentage of viewing time spent in a buffering state. A high ratio, even for a small segment of the audience, can indicate last-mile network congestion or an overly aggressive bitrate ladder in the encoding profile.
- Bitrate Switches: The frequency and direction of shifts in the Adaptive Bitrate (ABR) stream. Frequent downward switches suggest that the client-side bandwidth is insufficient for the rendered stream, providing valuable data for setting future encoding profiles.
- Playback Errors: Failed stream initializations or fatal playback errors. Correlating these errors with specific geographic regions, device types, or Internet Service Providers (ISPs) can help diagnose systemic delivery issues.
- Viewer Engagement: Player SDKs can track every user interaction, including play, pause, seek, and volume changes. Heatmaps generated from this data reveal which content segments were most engaging or confusing, directly informing future content creation.
This data is not captured by default. It requires proper integration of the player SDK within the destination web property or application and ensuring the OVP is configured to ingest and process this high volume of telemetry data. The choice of an enterprise OVP like Brightcove, Vimeo Enterprise, or Kaltura is critical, as their SDKs are purpose-built for this level of granular data collection.
Server-Side Analytics: Leveraging CDN Logs and Stream Health Monitoring
While player-side data provides QoE insights, server-side data from the CDN offers a macro-level view of delivery performance and Quality of Service (QoS). CDN logs contain a wealth of information about how your content is being requested and delivered globally. Analysis of these logs can reveal:
- Cache Hit Ratio: This indicates the percentage of content served from the CDN’s edge cache versus its origin shield or your primary origin server. A high cache hit ratio (typically above 95%) is essential for scalability and reducing latency. A low ratio might point to misconfigured cache-control headers or an inefficient origin storage architecture.
- Geographic Traffic Distribution: Understanding where your audience is concentrated is crucial for CDN strategy. If a significant portion of your audience is in a region poorly served by your primary CDN, the data may justify a multi-CDN strategy or engaging a provider with a stronger presence in that locale.
- Throughput and Time to First Byte (TTFB): These metrics measure the speed of data delivery from the edge server to the client. Consistently high TTFB in certain regions can indicate network peering issues between the CDN and local ISPs, a factor that is often beyond your direct control but essential for diagnosing performance complaints.
Beyond CDN logs, real-time stream health monitoring provides another layer of server-side data. During the live broadcast, contribution protocols like Secure Reliable Transport (SRT) provide detailed statistics on packet loss, latency, and jitter for the first-mile connection from the venue to the cloud. This data, captured from an SRT gateway or decoder, is invaluable for post-event analysis to correlate any delivery issues with problems during the initial ingest.
Key Technical Metrics That Drive Business Value
The raw data collected from the player and server is extensive. The next step is to distill this data into key performance indicators (KPIs) that provide actionable business intelligence. This involves moving beyond surface-level metrics and focusing on data points that reflect the technical success and business impact of the event.
Correlating QoS and QoE for a Holistic Performance View
The core of technical analysis is understanding the relationship between QoS and QoE. A QoS failure, such as high packet loss on the contribution feed (measured via SRT statistics), will inevitably lead to a QoE problem, such as video artifacts and buffering for the end-user. A robust post-event report should directly map these relationships. For example, a chart could show a spike in player-side buffering events that correlates precisely with a period of high network jitter on the ingest path. This allows the technical team to pinpoint the root cause of a poor viewer experience, moving the conversation from “the stream was glitchy” to “we experienced 3% packet loss between 10:15 and 10:20 AM due to ISP congestion on the primary uplink, and our bonded cellular backup successfully mitigated total failure”.
Granular Audience Segmentation and Engagement Analysis
True business value is unlocked when technical metrics are segmented by audience data captured during registration. By passing a unique user ID or other metadata to the player SDK, you can tie viewing behavior to specific business roles, departments, or geographic regions. This allows for powerful analysis:
- Executive Engagement: Did C-suite executives watch the entire quarterly town hall, or did they drop off after the opening remarks? This data can inform the structure and pacing of future executive communications.
- Product Interest: During a multi-segment product launch, which technical deep-dive session had the highest completion rate among viewers with an “engineer” job title? This provides direct feedback to product marketing teams.
- Global Reach: Did the Asia-Pacific sales team experience higher buffering rates than the North American team? This might justify provisioning a separate transcoding and delivery origin in an APAC cloud region for the next event.
Integrating Analytics into the Live Production Workflow
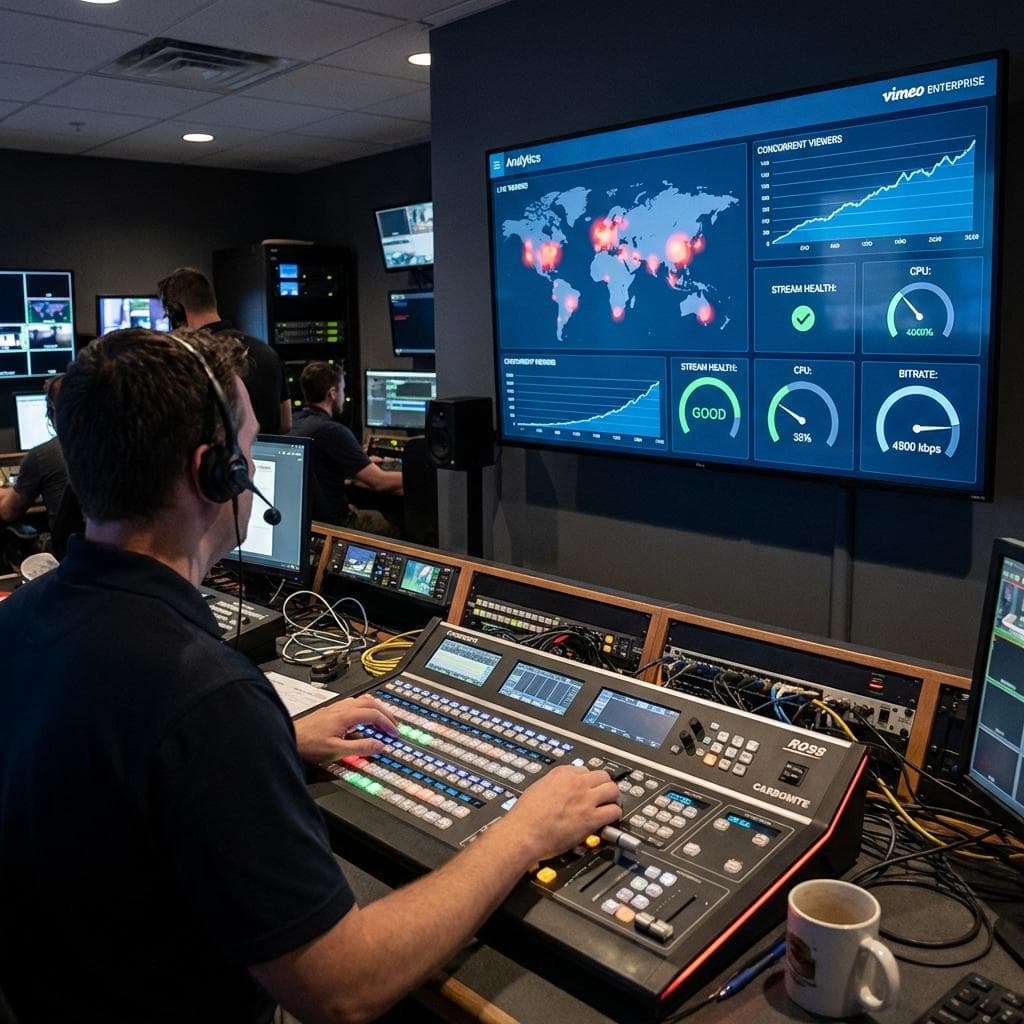
Post-event analytics should not exist in a vacuum. The insights gained from one event are critical inputs for the planning and execution of the next. This creates a continuous feedback loop where data informs and improves every stage of the production lifecycle.
Pre-Production Planning with Historical Data
Before a single piece of equipment is deployed, data from past events should inform key architectural decisions. For instance, if analytics from a previous all-hands meeting showed that 40% of viewers were watching on mobile devices over cellular networks, the encoding team can make an informed decision to adjust the ABR ladder. This might involve adding lower-bitrate profiles, such as 480p at 800 kbps, to ensure a smooth experience for those users. Similarly, if geographic data revealed a large cluster of viewers in South America, the production plan might now include a dedicated SRT ingest server in a Sao Paulo data center to reduce first-mile latency for remote presenters in that region.
ISO Recording and VOD Analytics for Content Strategy
In a multi-camera production, it is best practice to create isolated (ISO) recordings of each camera feed in addition to the main program output. Post-event, the analytics from the Video on Demand (VOD) version of the event can be incredibly revealing. If heatmap data shows that a particular 10-minute panel discussion was the most re-watched segment of the entire broadcast, the communications team can use the ISO recordings of the panelists’ cameras to create high-quality standalone content pieces for targeted follow-up campaigns. The analytics validate the content’s value, and the ISO recordings provide the high-quality source material, a workflow that connects data directly to content creation.
Actionable Strategies for Corporate Communications Infrastructure
Ultimately, the purpose of collecting and analyzing this vast amount of technical data is to make smarter business decisions. It is about justifying budgets, optimizing workflows, and proving the ROI of professional-grade streaming solutions.
Justifying Infrastructure Investments with Performance Metrics
When proposing an investment in a more robust infrastructure, such as a bonded cellular uplink for remote locations or a multi-CDN strategy for global events, post-event analytics provide the necessary evidence. You can present data showing the exact number of viewers impacted by network instability on a single-uplink stream versus the near-100% uptime achieved after implementing a bonded solution. You can show heatmaps of global latency and buffering rates to prove the necessity of a second CDN provider. This data transforms a budget request from a qualitative “we need it to be more reliable” to a quantitative “our current CDN resulted in a 12% buffering ratio for our European audience, representing 500 key stakeholders; a new provider with local PoPs will reduce this to under 1%.”
Refining Hybrid Event and Enterprise Streaming Strategy
For hybrid events, analytics are crucial for understanding the behavior of the virtual audience. Do remote attendees engage with polls and Q&A features as much as the in-person audience? At what point in a long broadcast do you see the most significant drop-off from remote viewers? This data is vital for designing more effective hybrid experiences, perhaps by scheduling dedicated interactive segments for the online audience or by breaking up longer content into more digestible VOD chapters post-event. By treating analytics as a core component of the production process, corporate communications teams can move from simply broadcasting events to engineering highly effective, data-driven communication strategies that deliver measurable business impact.

Jeremy Lee is a seasoned digital marketing director and strategist with over two decades of experience in the industry. As the founder of Sotavento Medios, I manage a diverse portfolio of over 50 businesses, helping brands grow through advanced search strategies and digital innovation. My work focuses on bridging the gap between traditional search engine optimisation and the evolving world of AI-driven answer engines.
get in touch