
The Data-Driven Mandate: Moving Beyond Vanity Metrics in Hybrid Productions
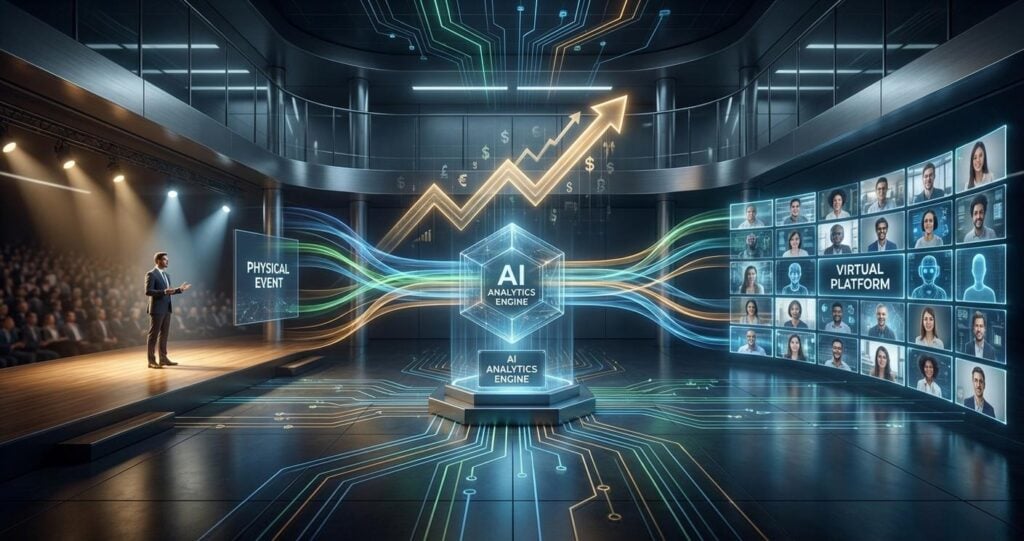
In the high-stakes environment of B2B corporate events, justifying budgetary spend requires more than anecdotal success stories and inflated attendance figures. For years, event ROI has been a nebulous concept, often reliant on post-event surveys and qualified lead counts that fail to capture the full spectrum of engagement. The complexity of hybrid events, with bifurcated audiences and disparate platforms, further complicates this calculus. Standard metrics like stream views or on-site headcount are fundamentally inadequate; they are vanity metrics that do not correlate directly to business impact. The critical challenge for production managers and IT directors is to move from simple measurement to meaningful intelligence. This requires a robust technical framework capable of ingesting, processing, and analyzing multidimensional data streams from both physical and virtual venues. This is where AI-driven analytics becomes not a luxury, but a core component of the production infrastructure, transforming the event from a logistical exercise into a quantifiable, strategic asset.
The true ROI of a hybrid event is concealed within layers of technical and behavioral data: network quality of service (QoS) metrics that impact viewer experience, granular engagement patterns on virtual platforms, physical attendee movements tracked via NFC, and real-time sentiment analysis derived from live chat. Harnessing this data requires a purpose-built analytics pipeline that integrates directly with your production workflow, from the camera sensor to the Content Delivery Network (CDN) edge. By correlating production-level telemetry with audience behavior and CRM data, we can finally draw a direct line from a specific keynote’s content to sales pipeline acceleration, proving value in the language that enterprise decision-makers understand: financial return and strategic advantage.
Architecting the Unified Data Collection Framework for Hybrid Events
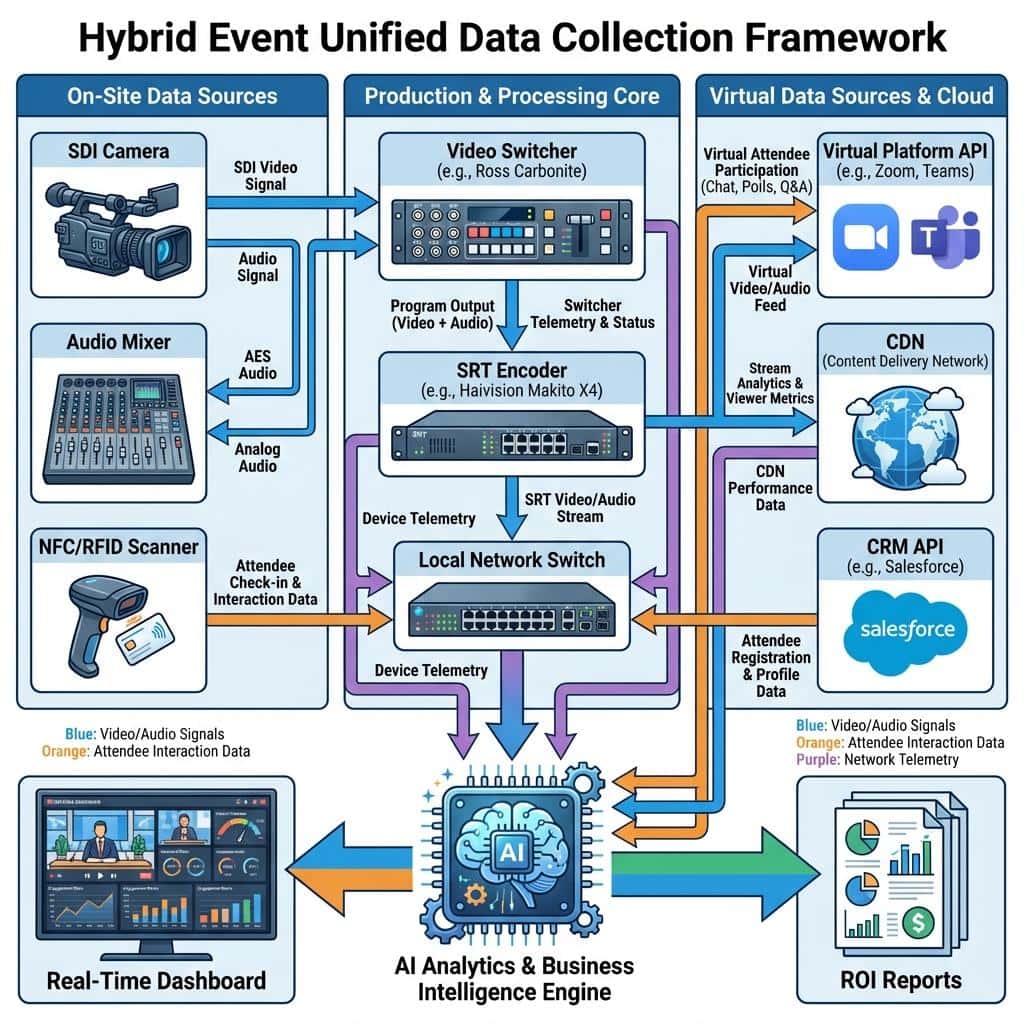
The foundation of any credible analytics strategy is a meticulously designed data collection architecture. For hybrid events, this necessitates a unified framework that seamlessly aggregates data from two distinct, yet concurrent, environments: the physical venue and the virtual streaming platform. These are not separate data silos; they are two halves of a single event experience, and their data must be correlated in real-time to build a comprehensive picture of audience engagement. This requires deep integration at the infrastructure level, extending beyond the capabilities of off-the-shelf event platforms.
Integrating On-Site and Virtual Data Ingress Points
On the physical side, data collection moves beyond simple badge scans. We deploy solutions like RFID or NFC (Near Field Communication) gateways at session entrances, sponsor booths, and networking zones. This provides high-fidelity data on attendee flow, dwell time, and content popularity, captured as structured data points with precise timestamps. On the virtual side, the approach shifts to API integration. We leverage the APIs of enterprise-grade platforms like Zoom Events, Webex, and Microsoft Teams to pull granular data: user-level login/logout times, session watch duration, poll participation, Q&A submissions, and file downloads. For custom RTMP/SRT-based streams delivered via platforms like Brightcove or Vimeo, we integrate with their player and CDN APIs to capture client-side QoS metrics like buffering ratios, bitrate shifts, and average watch time per user segment.
Leveraging Production Infrastructure for Deeper Telemetry
A significant portion of valuable data resides within the production infrastructure itself. Professional streaming encoders, such as those from Haivision, AJA, or Elemental, provide real-time telemetry on the health of the outgoing stream. We capture data on encoding engine load, output bitrate stability, and temperature of the hardware. For contribution feeds using Secure Reliable Transport (SRT), we analyze its rich statistical feedback: latency, packet loss, and jitter. This data is critical because it directly impacts the end-user experience. An AI model can correlate a 5% packet loss on the primary contribution feed with a 15% drop in virtual audience engagement a few seconds later. This allows us to proactively identify infrastructure bottlenecks and prove that investments in network redundancy and reliable transport protocols directly protect audience retention and, by extension, event ROI.
Core AI and Machine Learning Models for Event Intelligence
With a unified data pipeline in place, the raw telemetry must be processed into actionable intelligence. This is where AI and Machine Learning (ML) models are applied, transforming terabytes of disparate data points into predictive insights and real-time analysis. These are not generic, cloud-based AI services; they are specialized models trained on event-specific data to understand the unique dynamics of B2B audience behavior. The goal is to move from post-event reporting to in-flight optimization and predictive forecasting.
Real-Time Engagement and NLP Sentiment Analysis
During a live event, the chat, Q&A, and social media feeds are a firehose of unstructured data. We deploy Natural Language Processing (NLP) models to analyze this content in real time. These models are trained to understand industry-specific jargon and context, allowing them to perform sentiment analysis with high accuracy. The output is a real-time sentiment score, updated second-by-second. By synchronizing this sentiment data with the production switcher’s program log, we can pinpoint the exact moments that generate positive or negative reactions. For instance, we can identify that a specific feature announcement during a product demo at 10:32 AM caused a 40% spike in positive sentiment, while a confusing slide at 11:15 AM correlated with a surge in questions and neutral sentiment. This provides an empirical basis for content strategy refinement.

Predictive Analytics for Attendee Behavior and Resource Planning
Machine learning models can be used for more than just real-time analysis; they can be used to forecast behavior. By training a model on pre-event registration data (job title, company size, stated interests) and early engagement patterns (which emails they opened, which agenda sessions they bookmarked), we can predict which sessions are likely to be oversubscribed for both in-person and virtual audiences. This has direct operational implications. For IT directors, it allows for predictive scaling of cloud streaming resources and allocation of network bandwidth. If the model predicts a surge for a specific virtual breakout session, the system can automatically provision additional CDN capacity or scale the number of virtual machine instances handling the stream ingest, preventing system overloads and ensuring a high-quality experience for all viewers.
Translating Technical Metrics into Measurable Business ROI
The ultimate goal of this entire data infrastructure is to connect technical performance and audience engagement to tangible business outcomes. The most sophisticated analytics are meaningless unless they can be translated into the language of the C-suite: revenue, pipeline, and market influence. This requires closing the loop between the event data platform and core enterprise systems like Customer Relationship Management (CRM) and marketing automation platforms.
Correlating Content Engagement with the Sales Pipeline
This is where the true ROI becomes visible. By integrating the event analytics platform with a CRM like Salesforce, we can track the entire attendee journey. For example, a sales director can see that a specific high-value prospect attended two deep-dive technical sessions, downloaded a related whitepaper from the virtual platform, and asked a buying-intent question during the Q&A. The system can assign an engagement score to this lead and automatically flag it for priority sales follow-up. We can then track this lead through the sales cycle. Months later, we can definitively report that the event generated a specific number of sales-qualified leads, which resulted in a specific amount of closed-won revenue, attributing that revenue back to the specific event content that the user engaged with. This provides an undeniable, data-backed calculation of event ROI.
Quantifying Sponsorship Value with Granular Interaction Data
Sponsorship investment is a major component of event budgets. AI-driven analytics allows us to provide sponsors with value metrics that go far beyond logo visibility. Instead of a simple report of booth footfall, we can provide a detailed analysis of every interaction. A sponsor can receive a dashboard showing not just how many people visited their virtual booth, but the job titles of those visitors, the average dwell time, which pieces of content were downloaded most, and the sentiment of their brand mentions in public chat channels. For physical booths equipped with NFC readers, we can provide similar data on in-person interactions. This level of granular reporting justifies premium sponsorship tiers and turns sponsors into long-term partners who see a clear, measurable return on their investment.
Infrastructure and Implementation Strategy
Deploying an AI-driven analytics pipeline is a significant technical undertaking that requires careful planning around infrastructure, security, and data governance. The choice between on-premise, cloud, or hybrid solutions depends heavily on the client’s existing infrastructure, security posture, and the scale of the event. A successful implementation balances performance, scalability, and compliance.
On-Premise vs. Cloud-Based Analytics Pipelines
An on-premise solution offers maximum control and security, which is often a requirement for organizations in finance, healthcare, or government. This would involve deploying an analytics stack like Elasticsearch, Logstash, and Kibana (ELK Stack) on dedicated servers within the corporate network. Data from the production environment, including SRT telemetry and SDI signal monitoring, remains within the firewall. The trade-off is the significant capital expenditure and internal expertise required. A cloud-based approach, using services like AWS Kinesis for data streaming and Amazon SageMaker for ML models, offers immense scalability and faster deployment. This is ideal for events with massive, globally distributed virtual audiences. The primary consideration here is the network architecture required to securely and reliably transport vast amounts of event telemetry to the cloud for processing.
Ensuring Data Security, Privacy, and Compliance
Handling attendee data necessitates a rigorous approach to security and privacy. The entire analytics framework must be designed with compliance at its core, adhering to regulations like GDPR and CCPA. This involves implementing data anonymization techniques for certain types of analysis, ensuring all data is encrypted both in transit and at rest, and establishing clear data retention policies. For enterprise clients, the system must also align with internal security standards, such as ISO 27001. A trustworthy production partner must demonstrate a deep understanding of these requirements, building a secure analytics environment that protects both the attendees’ privacy and the client’s reputation.

Jeremy Lee is a seasoned digital marketing director and strategist with over two decades of experience in the industry. As the founder of Sotavento Medios, I manage a diverse portfolio of over 50 businesses, helping brands grow through advanced search strategies and digital innovation. My work focuses on bridging the gap between traditional search engine optimisation and the evolving world of AI-driven answer engines.
get in touch